Superstore Data Analysis Tableau Dashboard
Objective
The primary objective of this analysis is to delve into the Superstore data and extract meaningful insights that will help us construct a compelling and informative story for all stakeholders involved. By thoroughly examining the data, we aim to gain a deeper understanding of the store's performance and identify key areas for improvement and growth.
Data Points Analyzed
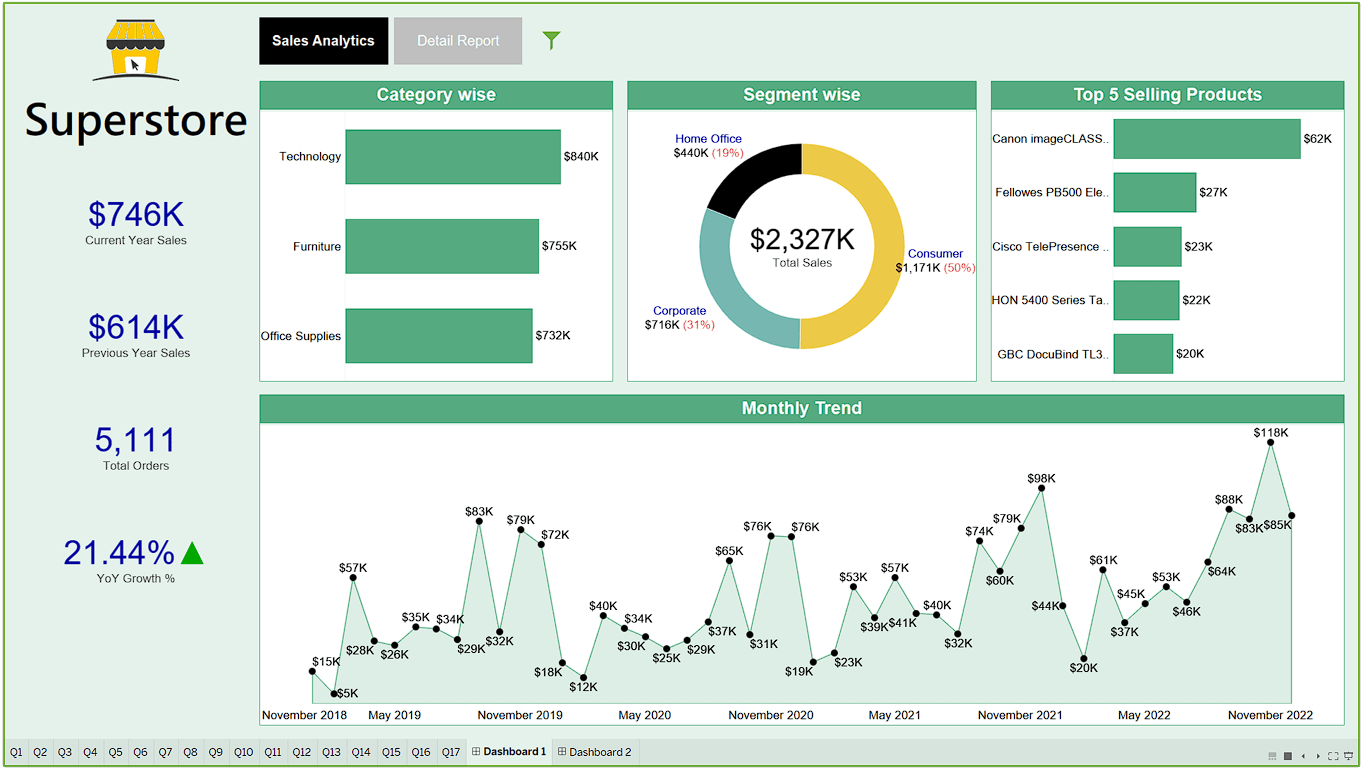
Category-Wise Sales Volume: We will explore the sales performance of different product categories within the Superstore. This analysis will enable us to identify which categories are driving the majority of the revenue and which ones might require attention to boost sales.
Segment-Wise Sales Volume: By segmenting the sales data based on customer segments (e.g., consumer, corporate, or home office), we can gain insights into the buying behavior of different customer groups. This information can help us tailor marketing and sales strategies to better meet the needs of each segment.
Top 5 Selling Products: Identifying the top-performing products is crucial for understanding customer preferences and market demand. By pinpointing the best-selling items, we can strategize inventory management and promotion tactics to capitalize on their popularity.
Monthly Sales Volume Trends: Analyzing the sales volume on a monthly basis allows us to detect any seasonal patterns or fluctuations in demand. Uncovering these trends can aid in better inventory planning, resource allocation, and understanding the store's overall performance over time.
Detailed Dashboard Report: We will create a comprehensive dashboard report that consolidates all our findings and visualizes the data in an easily digestible format. This report will serve as a powerful tool for stakeholders to quickly grasp the key takeaways and make data-driven decisions.
Through these analyses, we aim to empower the Superstore's stakeholders with valuable insights, enabling them to make informed business decisions and drive the store's success to new heights.
Tools Used: Tableau Public 2023.1
Dataset Details:-
• Domain: Retail
• Datasets: Superstore.xls
• Dataset Type: Excel Data
• Dataset Size: 20k+ records
31 May 2023