Placement Pulse: Automated Data Dashboard
JD Tracking & Placement Operations Dashboard - MyCaptain
Background & Context
At MyCaptain, the placements team handles a high volume of job descriptions (JDs) shared daily by recruiters and partners. These JDs are critical inputs for driving student placements, but the operational reality was challenging:
JDs were received through an auto-updating Google Sheet
Status tracking was manual, fragmented, and inconsistent
There was no reliable monthly overview of outcomes
Leadership-level questions required manual counting and cross-checking
Context behind decisions (closed, abandoned, no opt-ins) was often lost over time
As the person responsible for placement operations, I needed a system that was:
Fast enough for daily usage
Structured enough for monthly reporting
Simple enough to avoid operational overhead
This led to the decision to design and build a dedicated JD Tracking Dashboard.
Problem Statement
The core problem wasn’t the lack of data — it was the lack of clarity and structure.
Specifically:
There was no single source of truth for JD status
Status updates had no historical traceability
Monthly metrics (completed, hired, abandoned, ongoing) were not easily accessible
Operational insights depended heavily on memory or manual effort
The existing Google Sheet worked well as an input feed, but not as an operations or analytics tool.
Goals & Objectives
The primary objective was to create a single, reliable system that could support both daily operations and monthly decision-making.
Key goals:
Enable once-a-day, low-effort status updates
Maintain a full history of status changes with timestamps
Provide a clear monthly overview without manual calculations
Separate raw input data from operational intelligence
Keep the system simple, focused, and scalable
Solution Overview
I designed a web-based internal dashboard that acts as the system of record for all JD tracking activities.
Key design decisions:
Google Sheet remains read-only and is used only to ingest new JDs
The dashboard owns:
JD status
Status history
Completion outcomes
Monthly insights
Each JD is uniquely identified using a Job ID, ensuring zero duplication
The system is optimized for a single daily admin update workflow
Core Features
1. JD Master Table (Primary Workspace)
A central table displaying all JDs fetched from the Google Sheet, enriched with operational fields.
Key columns include:
Job ID (unique identifier)
Company name, role, job type, experience, and CTC ranges
Current JD status
Status timestamp (latest update)
Completion status (Hired / Not Hired)
Completion date
Free-text comments for context
The table supports inline status updates, allowing changes to be made quickly without navigating away or opening modals.
2. Structured Status Workflow
Each JD moves through clearly defined states such as:
Yet to Start
Started
On-Going
List to be Shared
No Opt Ins
Completed
Closed
Abandoned
For completed roles, outcomes are captured as:
Completed – Hired
Completed – Not Hired
Every status change is recorded with:
Timestamp
Previous and new status
Optional contextual comment
This creates a complete audit trail of each JD’s lifecycle.
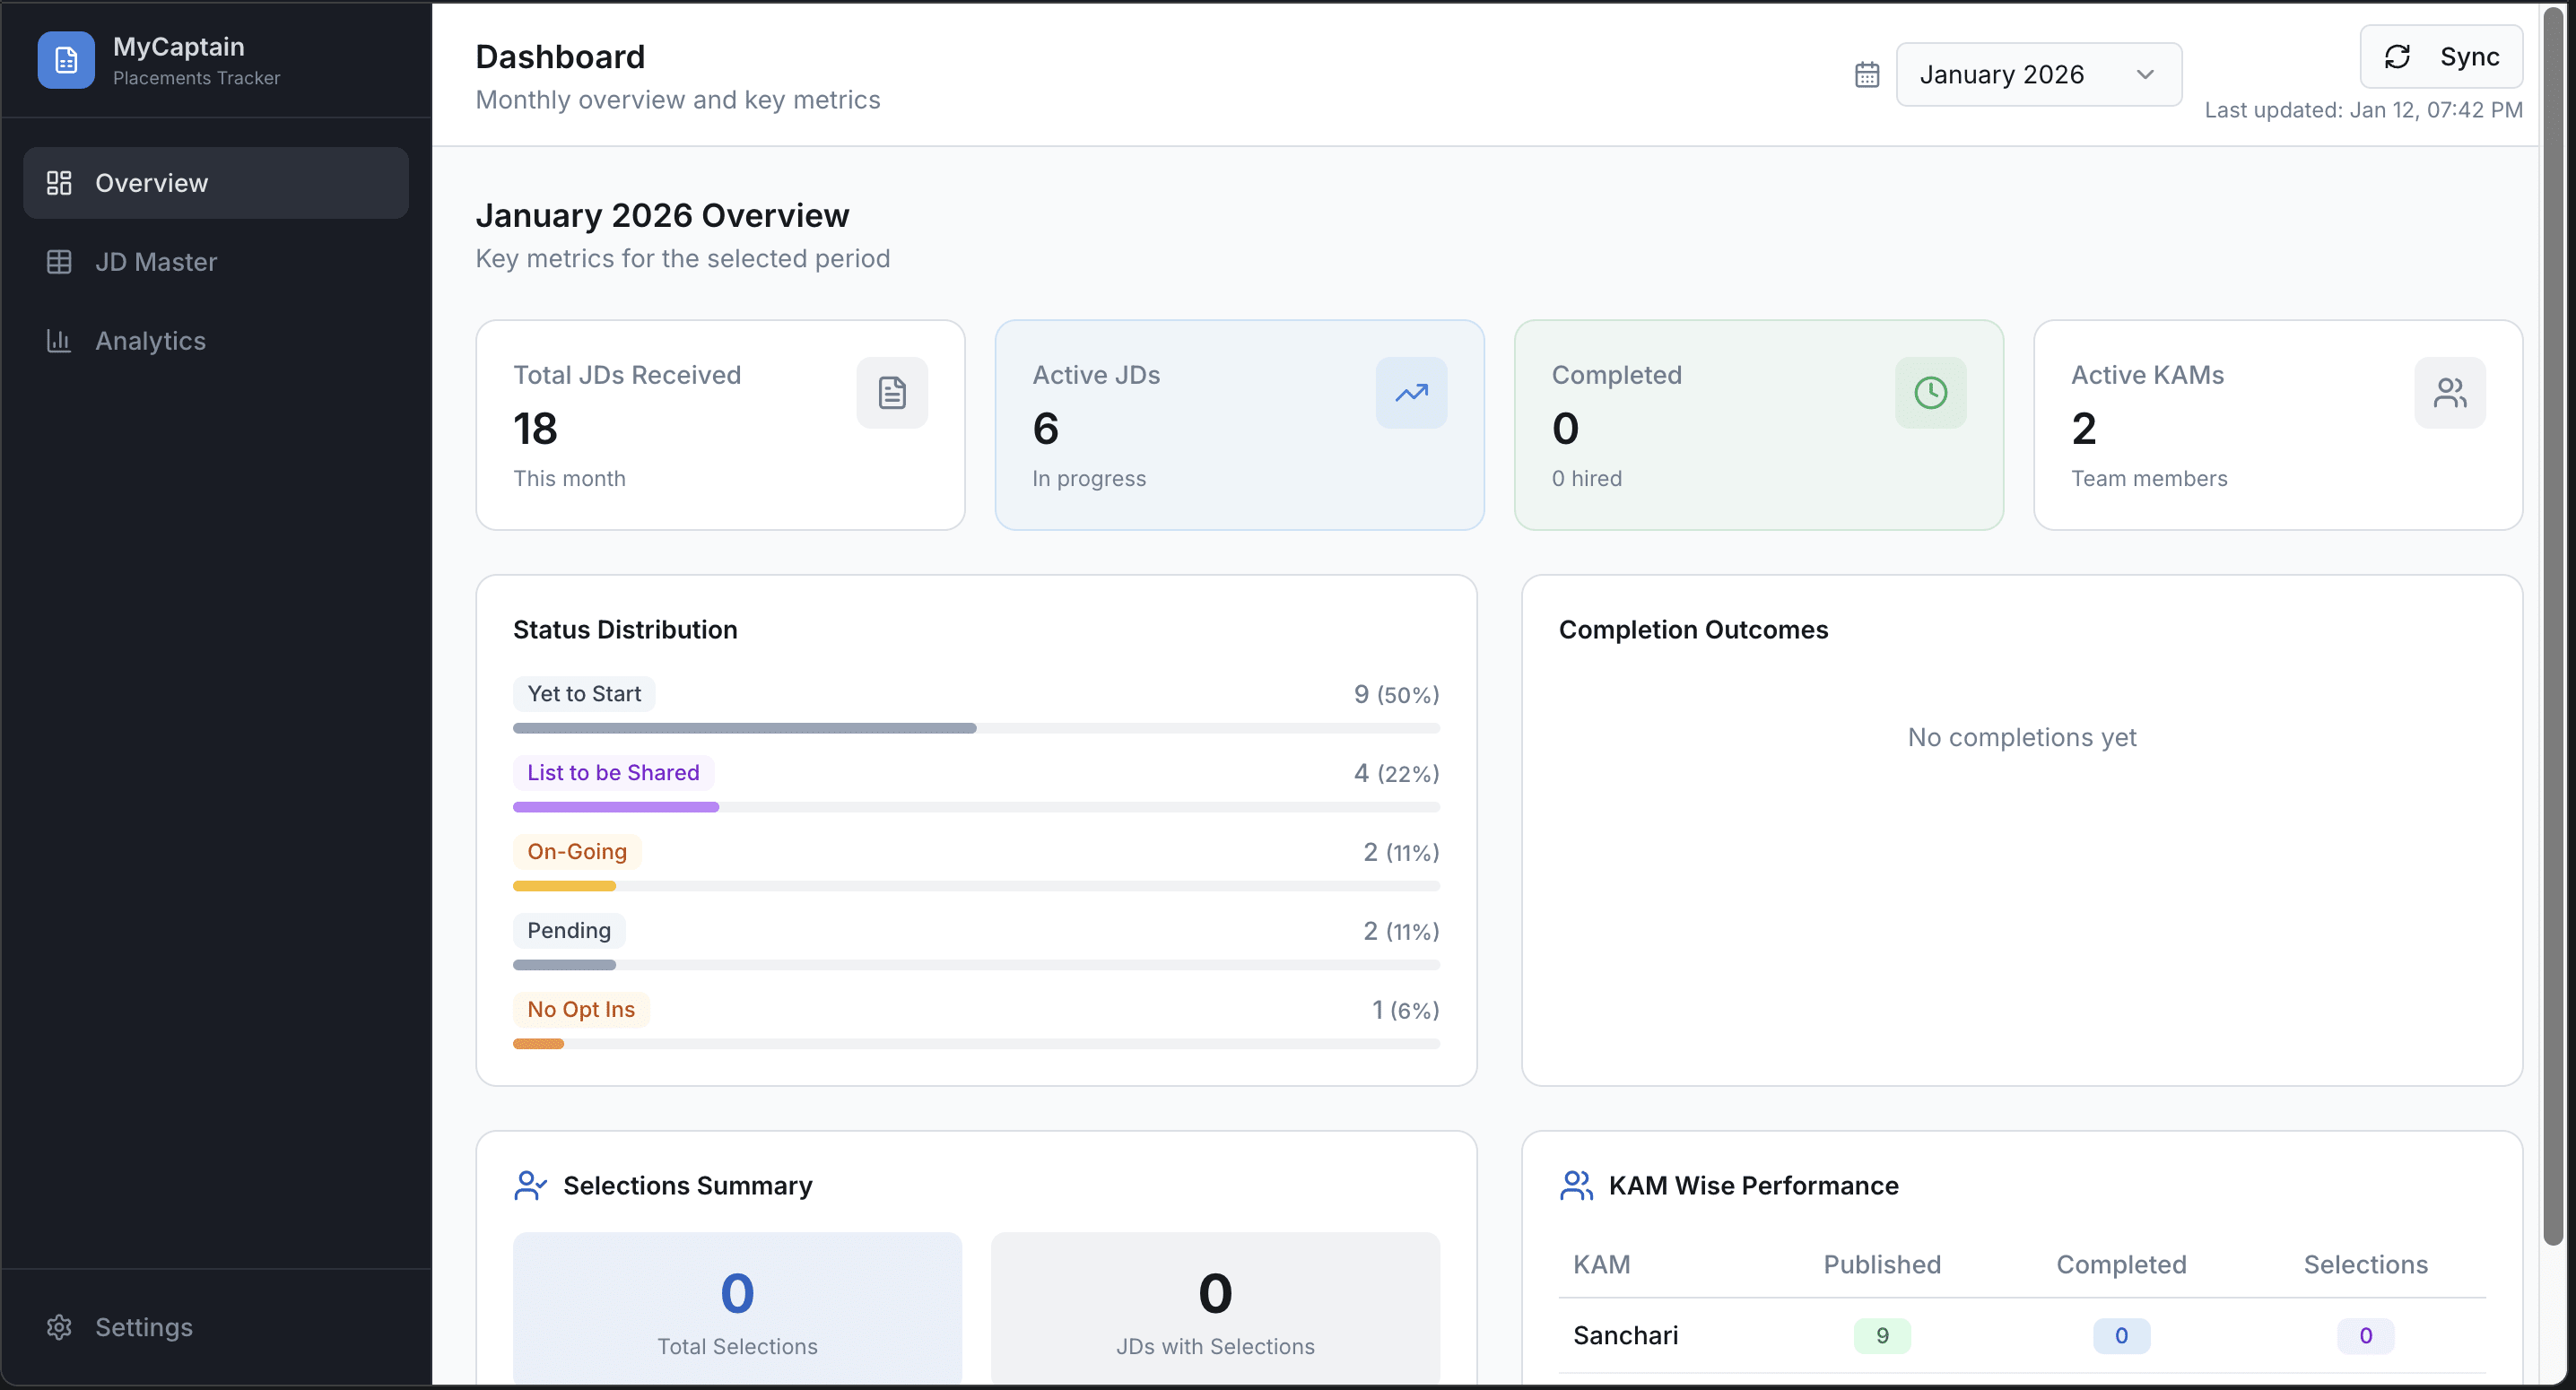
3. Monthly Overview & Pivot-Style Insights
A dedicated overview section provides leadership-ready insights, similar to a pivot table.
Monthly metrics include:
Total JDs received in the selected month
Distribution of JDs by current status
Number of JDs resulting in Hired vs Not Hired
JDs still On-Going at month end
The overview updates dynamically based on the selected month, eliminating the need for manual tracking or spreadsheets.
Impact & Outcomes
Operational Impact
Daily JD updates now take under 10 minutes
Status clarity has improved significantly
Context behind decisions is preserved via comments
No more ambiguity around JD state or ownership
Analytical Impact
Monthly placement reviews require zero manual counting
Leadership questions can be answered instantly
Clear visibility into bottlenecks (e.g. prolonged On-Going JDs)
Strategic Impact
The dashboard acts as a foundation for future insights
Enables data-driven decisions without increasing operational load
Key Learnings
Google Sheets are excellent input tools, but poor systems of record
Status history is far more valuable than static status fields
Designing for real usage patterns (once-a-day updates) is more important than feature richness
Clear constraints (single user, daily updates) lead to better product decisions
Final Thoughts
This project transformed a fragmented, manual process into a structured operational system without increasing complexity. By focusing on clarity, ownership, and real-world workflows, the dashboard now serves as a trusted backbone for placement operations at MyCaptain.
01 Jan 2026