
Daily Sales Dashboard
Daily Sales Dashboard
Client: Small business
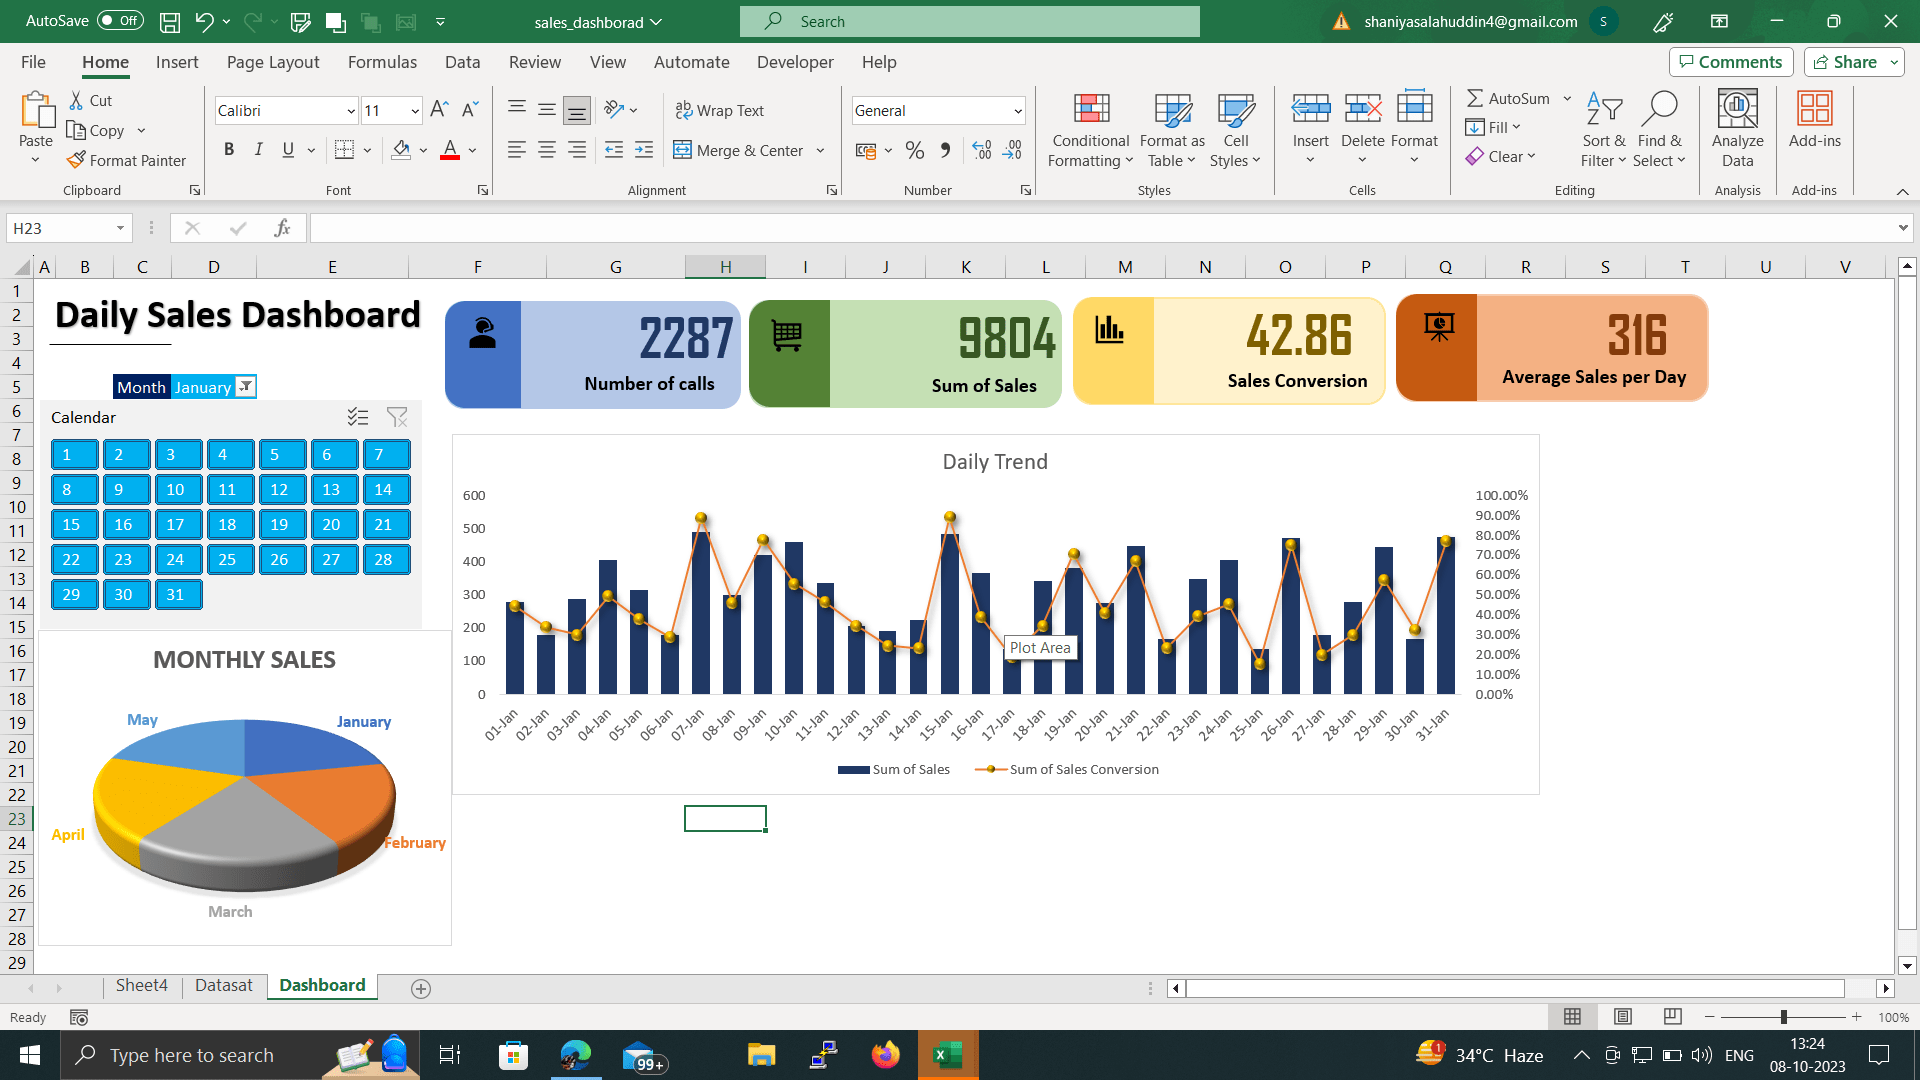
Project: Create a fully dynamic Excel pivot table dashboard to track cold call performance month and day.
Challenges:
- The client wanted a dashboard that would be easy to use and update.
- The dashboard needed to be dynamic so that the client could easily see their data for different periods.
- The dashboard needed to be able to track a variety of metrics, including the number of calls, sales conversion, the sum of sales, average sales per day, and the sum of sales according to 6 months (January to May).
Solution:
I created a fully dynamic Excel pivot table dashboard that met all of the client's requirements. The dashboard is easy to use and update, and it allows the client to see their data for different periods and track a variety of metrics.
Features:
- The dashboard is fully dynamic, so the client can easily see their data for different periods.
- The dashboard tracks a variety of metrics, including the number of calls, sales conversion, the sum of sales, average sales per day, and the sum of sales according to 6 months (January to May).
- The dashboard is easy to use and update.
- The dashboard is visually appealing and easy to understand.
Benefits:
- The dashboard helps the client to track their cold calls performance month and day.
- The dashboard helps the client to identify areas where they can improve their cold-calling process.
- The dashboard helps the client to make better decisions about their sales strategy.
Overall, the project was a success. The client was very happy with the dashboard and it has helped them to improve their cold calls performance.
02 Aug 2023
Keywords
Data analysis
Excel Dashboard